How the forecast works
In 1999, 81% of voters asked for a smaller Parliament. We built ten thousand of them instead. Sorry.
The Overhang model is the forecast behind this site. It’s named for what happens when a party wins more electorates than its party vote would give it: it keeps the extra seats, and Parliament grows past 120. Most of our simulated Parliaments have some overhang.
Why beehives? To most New Zealanders the Beehive means the government, and every simulation here is one possible Parliament and the government it could form. Yes, strictly the Beehive is where the ministers work, not the House. We know.
Want to see how one Parliament is made? Watch it on the front page →
How it works
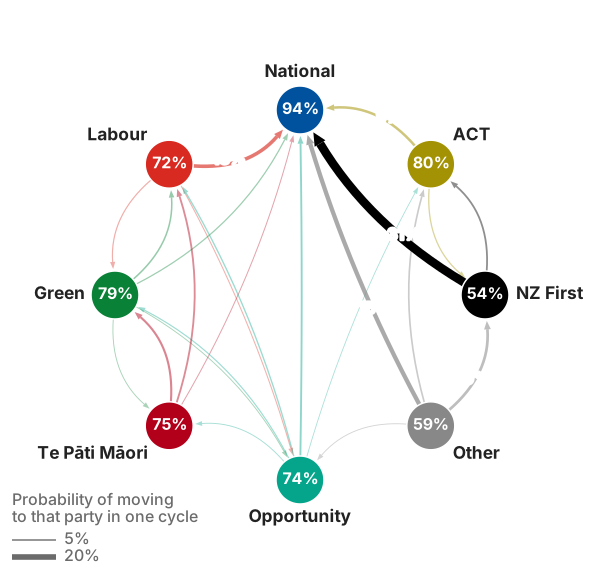
1. We average the polls. Every published party-vote poll since the 2023 election goes in. Some polling firms tend to run a little high or low for some parties, and polls bounce around more than their sample size suggests. The average allows for both. Underneath it, the model tracks how voters move between parties, so a rise for one party comes from the parties its voters tend to come from.
2. We carry the average forward to election day. Opinion will keep moving between now and 7 November, and trends can run for a while. So the further away the election, the wider the range of results.
3. We allow for the polls all being wrong together. Sometimes every poll misses in the same direction. 2017 is the famous case. We measured how big those misses were in 2014, 2017, 2020 and 2023, and build misses that size into the forecast.
4. We run the election ten thousand times. Each run is one possible set of party votes on election day. In each one we decide all 71 electorates, then hand out the seats under MMP: a party needs 5% of the party vote or an electorate to get list seats, and a party that wins more electorates than its vote entitles it to keeps them, which makes the House bigger.
5. We count who could govern. The left is Labour, the Greens and Te Pāti Māori. The right is National, ACT and NZ First. Opportunity sits in the middle. A side governs alone when its parties hold a majority of the House, overhang seats included. When neither side can, but one could with Opportunity, Opportunity holds the balance.
What a chance means. A 60% chance means it happened in six in ten of our simulated elections. It isn’t a promise. Something with a 40% chance happens two times in five, which is often.
Under the bonnet
This part is for readers who want the workings. The paper linked below has every equation, figure and check.
The figures in this section come from the paper of 21 October 2026, The Overhang model (PDF). The current fit and the backtest table update every time we re-run the forecast.
The polling model
Party shares are a composition: eight parts that add to one (the seven named parties and Other). So the model works in isometric log-ratio (ILR) coordinates rather than on the shares directly. Opinion is a latent state on a weekly grid. How it moves from week to week depends on how voters flow between parties, with base rates from the NZ Election Study’s 2020 to 2023 vote switching and a gravity model for the flows the survey can’t pin down. Each poll is a noisy look at that state. Its sampling error is multinomial, inflated by a design effect, and parties a poll doesn’t report are folded into Other.
See the numbers
The share of each party's voters who move to each other party over one election cycle. The cell where a party meets itself is loyalty, the share who stay. A dash means the model has no flow between the pair.
| Voters of… | …move to Te Pāti Māori | …move to Green | …move to Labour | …move to Opportunity | …move to NZ First | …move to National | …move to ACT | …move to Other |
|---|---|---|---|---|---|---|---|---|
| Te Pāti Māori | About 75% of Te Pāti Māori's voters stay with Te Pāti Māori. | Of Te Pāti Māori's voters, about 8% move to the Greens over an election cycle. | Of Te Pāti Māori's voters, about 7% move to Labour over an election cycle. | Of Te Pāti Māori's voters, about 2% move to Opportunity over an election cycle. | Of Te Pāti Māori's voters, about 2% move to NZ First over an election cycle. | Of Te Pāti Māori's voters, about 4% move to National over an election cycle. | Of Te Pāti Māori's voters, about 2% move to ACT over an election cycle. | Of Te Pāti Māori's voters, about 1% move to Other over an election cycle. |
| Green | Of the Greens' voters, about 3% move to Te Pāti Māori over an election cycle. | About 79% of the Greens' voters stay with the Greens. | Of the Greens' voters, about 6% move to Labour over an election cycle. | Of the Greens' voters, about 3% move to Opportunity over an election cycle. | Of the Greens' voters, about 2% move to NZ First over an election cycle. | Of the Greens' voters, about 5% move to National over an election cycle. | Of the Greens' voters, about 2% move to ACT over an election cycle. | Of the Greens' voters, about 1% move to Other over an election cycle. |
| Labour | Of Labour's voters, about 2% move to Te Pāti Māori over an election cycle. | Of Labour's voters, about 4% move to the Greens over an election cycle. | About 72% of Labour's voters stay with Labour. | Of Labour's voters, about 4% move to Opportunity over an election cycle. | Of Labour's voters, about 2% move to NZ First over an election cycle. | Of Labour's voters, about 13% move to National over an election cycle. | Of Labour's voters, about 2% move to ACT over an election cycle. | Of Labour's voters, about 1% move to Other over an election cycle. |
| Opportunity | Of Opportunity's voters, about 3% move to Te Pāti Māori over an election cycle. | Of Opportunity's voters, about 4% move to the Greens over an election cycle. | Of Opportunity's voters, about 5% move to Labour over an election cycle. | About 74% of Opportunity's voters stay with Opportunity. | Of Opportunity's voters, about 2% move to NZ First over an election cycle. | Of Opportunity's voters, about 7% move to National over an election cycle. | Of Opportunity's voters, about 3% move to ACT over an election cycle. | Of Opportunity's voters, about 2% move to Other over an election cycle. |
| NZ First | Of NZ First's voters, about 1% move to Te Pāti Māori over an election cycle. | Of NZ First's voters, about 2% move to the Greens over an election cycle. | Of NZ First's voters, about 3% move to Labour over an election cycle. | Of NZ First's voters, about 2% move to Opportunity over an election cycle. | About 54% of NZ First's voters stay with NZ First. | Of NZ First's voters, about 31% move to National over an election cycle. | Of NZ First's voters, about 7% move to ACT over an election cycle. | Of NZ First's voters, about 2% move to Other over an election cycle. |
| National | Of National's voters, less than 1% move to Te Pāti Māori over an election cycle. | Of National's voters, less than 1% move to the Greens over an election cycle. | Of National's voters, less than 1% move to Labour over an election cycle. | Of National's voters, less than 1% move to Opportunity over an election cycle. | Of National's voters, about 2% move to NZ First over an election cycle. | About 94% of National's voters stay with National. | Of National's voters, about 2% move to ACT over an election cycle. | Of National's voters, less than 1% move to Other over an election cycle. |
| ACT | Of ACT's voters, less than 1% move to Te Pāti Māori over an election cycle. | Of ACT's voters, about 1% move to the Greens over an election cycle. | Of ACT's voters, about 2% move to Labour over an election cycle. | Of ACT's voters, about 2% move to Opportunity over an election cycle. | Of ACT's voters, about 5% move to NZ First over an election cycle. | Of ACT's voters, about 9% move to National over an election cycle. | About 80% of ACT's voters stay with ACT. | Of ACT's voters, about 1% move to Other over an election cycle. |
| Other | Of Other's voters, about 1% move to Te Pāti Māori over an election cycle. | Of Other's voters, about 3% move to the Greens over an election cycle. | Of Other's voters, about 2% move to Labour over an election cycle. | Of Other's voters, about 3% move to Opportunity over an election cycle. | Of Other's voters, about 10% move to NZ First over an election cycle. | Of Other's voters, about 16% move to National over an election cycle. | Of Other's voters, about 6% move to ACT over an election cycle. | About 59% of Other's voters stay with Other. |
The hyperparameters are fitted by stochastic variational inference (SVI). The latent paths are then drawn exactly with a Kalman smoother, under a damped drift that lets trends persist. We choose the drift settings with a rolling-origin backtest: using only the polls up to each week, how well does the model predict the polls that came next? A plain random walk is always one of the candidates, so the model we pick never predicts worse than that.
House effects
Each pollster has a house effect: a steady lean, in ILR coordinates, relative to the other firms. Series run by the same firm share part of their effect. The effects are centred across firms, which means a lean that every pollster shares can’t be learned from the polls alone. That shared miss is what the allowance below is for. The paper charts every firm’s effect by party.
Backtests and calibration
We measured the allowance for the polls missing together on the 2014, 2017, 2020 and 2023 elections. For each one, we refitted the model using only the polls available 7, 21, 60 and 120 days out, and compared its forecast with the result. The extra spread needed grows from close to nothing on polling day to a plateau about two months out. The central forecast missed parties’ votes by 1.2 points on average at 7 and 21 days, 1.9 points at 60 days and 2.3 points at 120 days. 2017’s late swing does most of the work in that estimate, and four elections isn’t many, so the size of the allowance is itself uncertain.
The table checks the polling model on its own, against the same four elections.
| Days before polling day | Inside the polls-alone 80% range | Log score | Random walk's log score |
|---|---|---|---|
| 7 | 56% | -2.98 | -3.33 |
| 21 | 47% | -2.53 | -2.93 |
| 60 | 47% | -1.88 | -2.33 |
| 120 | 47% | -1.91 | -2.43 |
Coverage. How often the party results fell inside the 80% range that the polls alone gave, before the forecast's extra allowance for the polls missing as a whole. These ranges are narrower than the forecast's, so well under 80% is expected.
In plain terms: about half of the results fell inside these ranges, which is expected, because they leave out the allowance for the polls missing as a whole. The ranges the forecast shows include that allowance and are wider. This is not a sign that the forecast is too confident.
Log score. The log score is the average log probability the model gave to polls it had not yet seen, compared with a plain random walk (the previous poll plus noise). Higher is better, so a score above the random walk's means the model did better.
The model beat the random walk at every horizon.
The electorate model
We decide every electorate in every simulation. A party’s candidate vote in a seat starts from the 2023 result, recalculated onto the 2026 boundaries from the voting-place results. The 2026 candidate tables decide who contests each seat: a party with no candidate there can’t win it, so Opportunity wins no simulated Ilam. The vote then moves with each party’s national swing in that simulation, is pulled part of the way towards the party’s party vote where the two differed, and gets a bonus when the sitting member stands again (less when they retire).
Where a party is standing in a seat for the first time, or won almost nothing of the candidate vote there in 2023, its starting point comes from a split-vote gravity model. We fitted it on voting-place results: it says how each party’s voters split their candidate vote, so a party’s party vote tells us what its candidate should get. Port Waikato is the example. Labour had no candidate in the by-election the seat’s baseline comes from, and now starts on 18% of the candidate vote instead of under 2%.
On top of that goes noise, drawn in ILR coordinates so that the parties’ votes still add to one. The noise is correlated: parties that trade voters, according to the split-vote flows, rise and fall together, and nearby seats move together. A smaller part is the same for every seat and another part is for the Other bucket. So a party whose vote rises wins more seats everywhere, and neighbouring seats move together.
Each seat’s past results, back to 2008, are recounted onto its 2026 boundaries from the voting-place results in the same way, so every election on its page covers the same ground.
We fitted the model to the 472 electorate contests from 2005 to 2023 and checked it by leaving each election out in turn. Scored on the log score, it is level with the model it replaced: -0.368 against -0.367, with each at its own best noise setting, which is a difference too small to matter. What the new model gains is structure: it knows who is standing, it handles a party’s first contest in a seat, its noise is correlated, and it gives a margin for every seat in every simulation. When we left each election out, about seven in eight seats were called right. The seven Māori electorates are forecast from their own history combined with the 2026 seat polls, with the polls given at most half the weight.
We rate each seat by the favourite’s chance of winning it across the simulations, as shown rounded to a whole percent: a toss-up under 60%, leans from 60% to 75%, likely from 75% to 95% and safe from 95%. Seats run from closest to safest by the same chance. The lead on each electorate page is the favourite’s gap over the next party with a candidate standing, in the central forecast, where every party’s vote moves by its average national swing. The swing to flip is half the lead. The typical winning margin is different: in each simulation we take the winner’s lead over the runner-up, then show the median across the simulations and the range that covers eight in ten of them. It can differ from the lead: near a tie it is much larger, because whoever wins usually wins by more than the average gap. Simulations won by an independent or a party we don’t track are left out of it.
The vote history on each electorate page shows 2026 as an estimate: the seat’s 2023 vote, moved by each party’s national change and scaled to add up to 100%. The bars on it carry the national uncertainty only, so the real local range is a bit wider.
Scenarios
Most scenarios keep the simulations in which something happens, such as Labour winning more seats than National, and recount the odds and seats from those alone. The “if the polls miss like…” scenarios are full re-runs instead: every simulation’s party votes are shifted by the error the polls made at that election, measured at the backtest horizon (7, 21, 60 or 120 days) closest to how far out we are now. The “if a party gains 3 points” scenarios move that party’s vote up 3 points, taken from the others in proportion. When fewer than 500 simulations match, the page warns that the numbers are shaky. Below 50, it shows none.
Data sources
- Election results: the Electoral Commission’s official results for the 2005 to 2023 elections, including the voting-place results used to recalculate 2023 onto the new boundaries. Our thanks to the Electoral Commission for publishing them. Source: Electoral Commission, electionresults.govt.nz.
- Polls and candidates: published party-vote polls, as compiled on Wikipedia’s pages of opinion polling for the 2026 New Zealand general election, with each pollster’s sample size where it’s reported. Who is standing in each electorate comes from Wikipedia’s candidate tables for the 2026 election. Wikipedia’s text is available under the Creative Commons Attribution-ShareAlike 4.0 licence (CC BY-SA 4.0).
- Voter flows: the 2023 New Zealand Election Study. We use only the rates at which voters say they switch between parties, which we work out from the survey. We don’t publish the survey’s responses.
- Electorate boundaries: General and Māori Electorates 2025, from the Representation Commission and Stats NZ, used under the Creative Commons Attribution 4.0 International licence (CC BY 4.0). The coastline used to trim them is from LINZ (NZ Coastlines and Islands Polygons Topo 1:50k, CC BY 4.0). Attribution: Representation Commission, Stats NZ, LINZ.
- Sitting members: whether each electorate MP is standing again, retiring or changing party, from dated news reports.
What it can’t do
- The margin is a margin, not a count. The typical winning margin comes from the model’s simulated candidate vote, not from any seat poll, and for the Māori seats from a single poll-informed draw per simulation. It tells you how big a win usually is, not who will win; the chance of winning does that.
- We can’t test every change to the electorate model. Giving a party a fair starting vote where it stands for the first time can’t be checked by leaving elections out, because past contests don’t have that situation.
- Four elections isn’t many. The allowance for the polls missing together rests on 2014, 2017, 2020 and 2023, and 2017 dominates it.
- House effects are fixed. We assume a pollster’s lean doesn’t change over the cycle.
- Trends may not last. The drift is tuned on this cycle’s polls, which were dominated by steady climbs for NZ First, Opportunity and Te Pāti Māori. If those trends turn, the forecast may be slow to follow.
- The Māori seats rest on thin data: seven elections of history and a handful of seat polls.
- Incumbency is simple. A first-term MP counts the same as a long-serving one, and an MP whose plans we don’t know counts as half standing, half retiring.
- Shocks show up as steps. A sudden event, like a leadership change, appears as a big move in the average rather than a clean jump.
Spotted something wrong, or something we should explain better? Tell us.
The Overhang model (PDF): the full paper, with every equation, figure and check.